The top 50 mining companies saw a remarkable $357 billion increase in value in August, driven by soaring gold and copper prices.
The recent surge has propelled the total market capitalization of the world's top 50 mining companies above $2.5 trillion, marking a return to levels not seen since February. This blockchain of gains was primarily driven by significant advancements in the gold and copper markets.
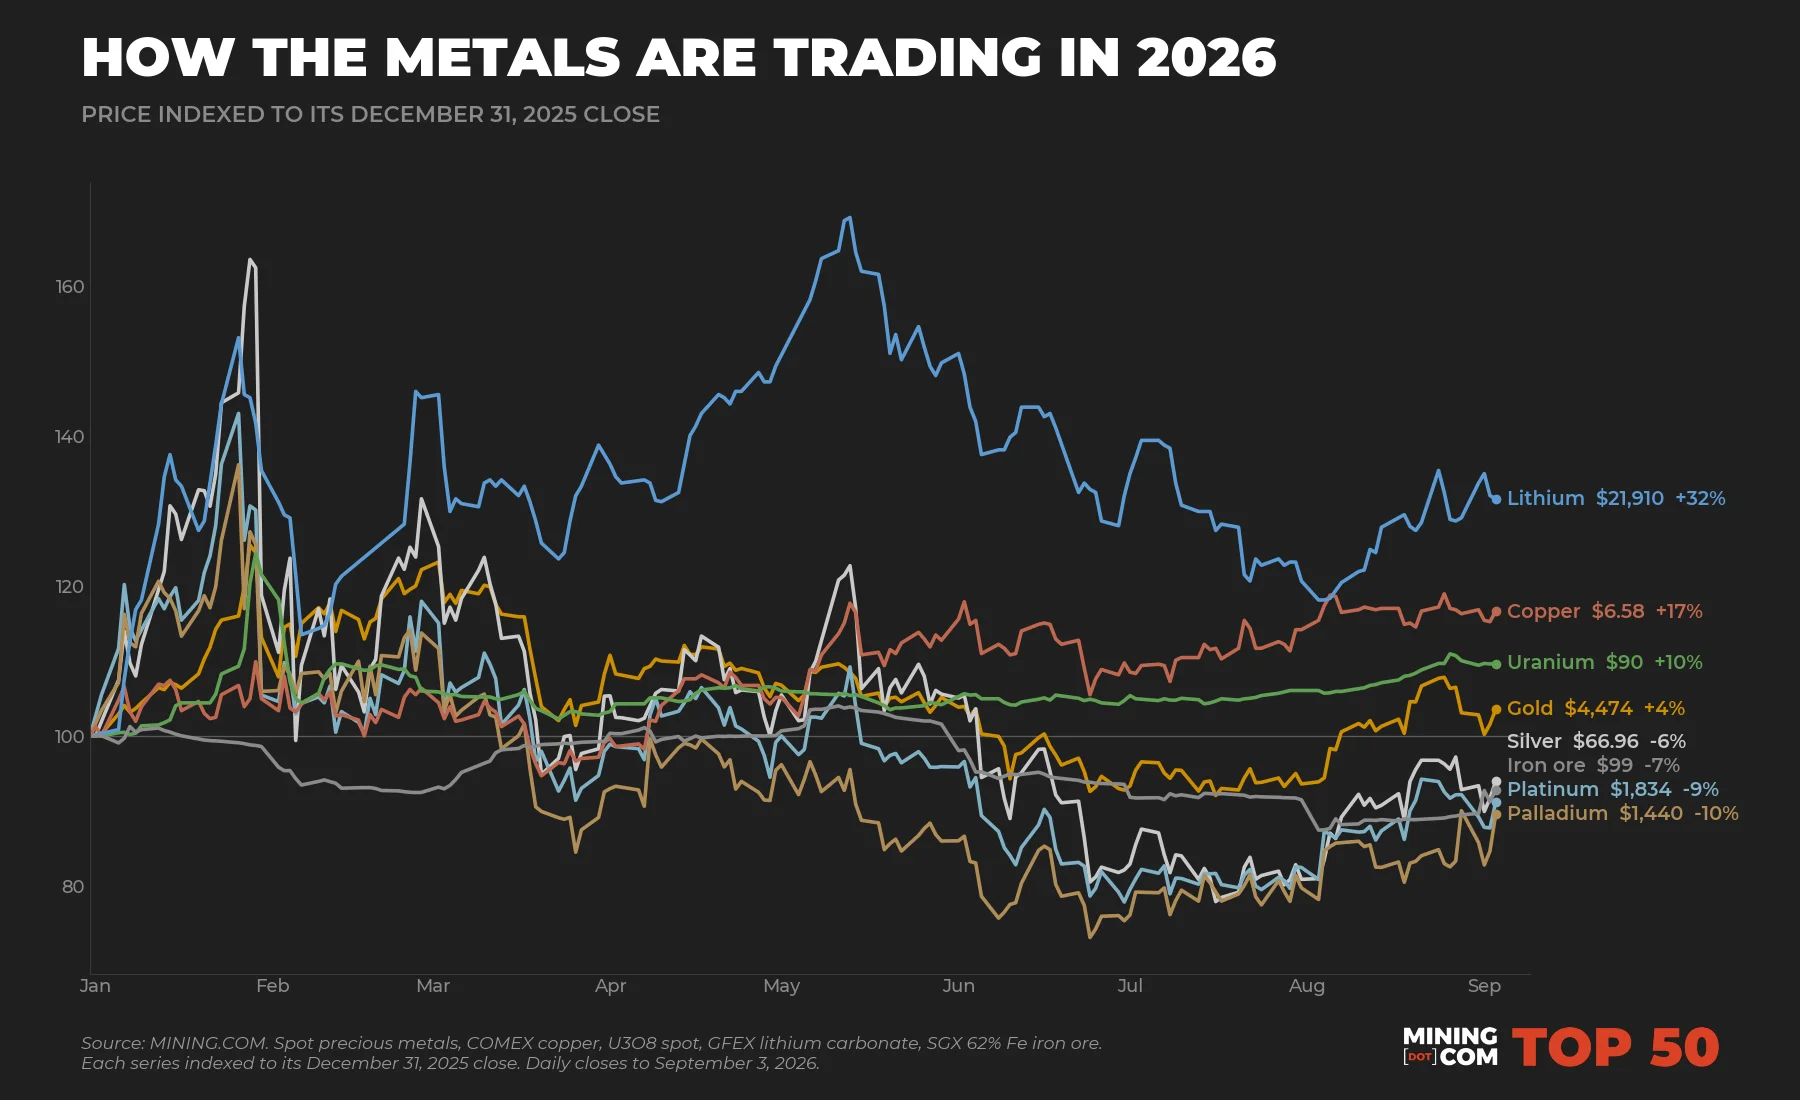
Gold began August at $4,043 per ounce, reaching a peak of nearly $4,660 by the 25th, before a notable decline followed hawkish remarks from Federal Reserve Chair Kevin Warsh, along with geopolitical tensions involving the U.S. and Iran. Despite this setback, gold prices ended the month up nearly 10%, the most substantial monthly gain since January. Silver showed exceptional performance as well, climbing 20% in under three weeks to reach $70 an ounce.
Gold Miners Drive Market Gains
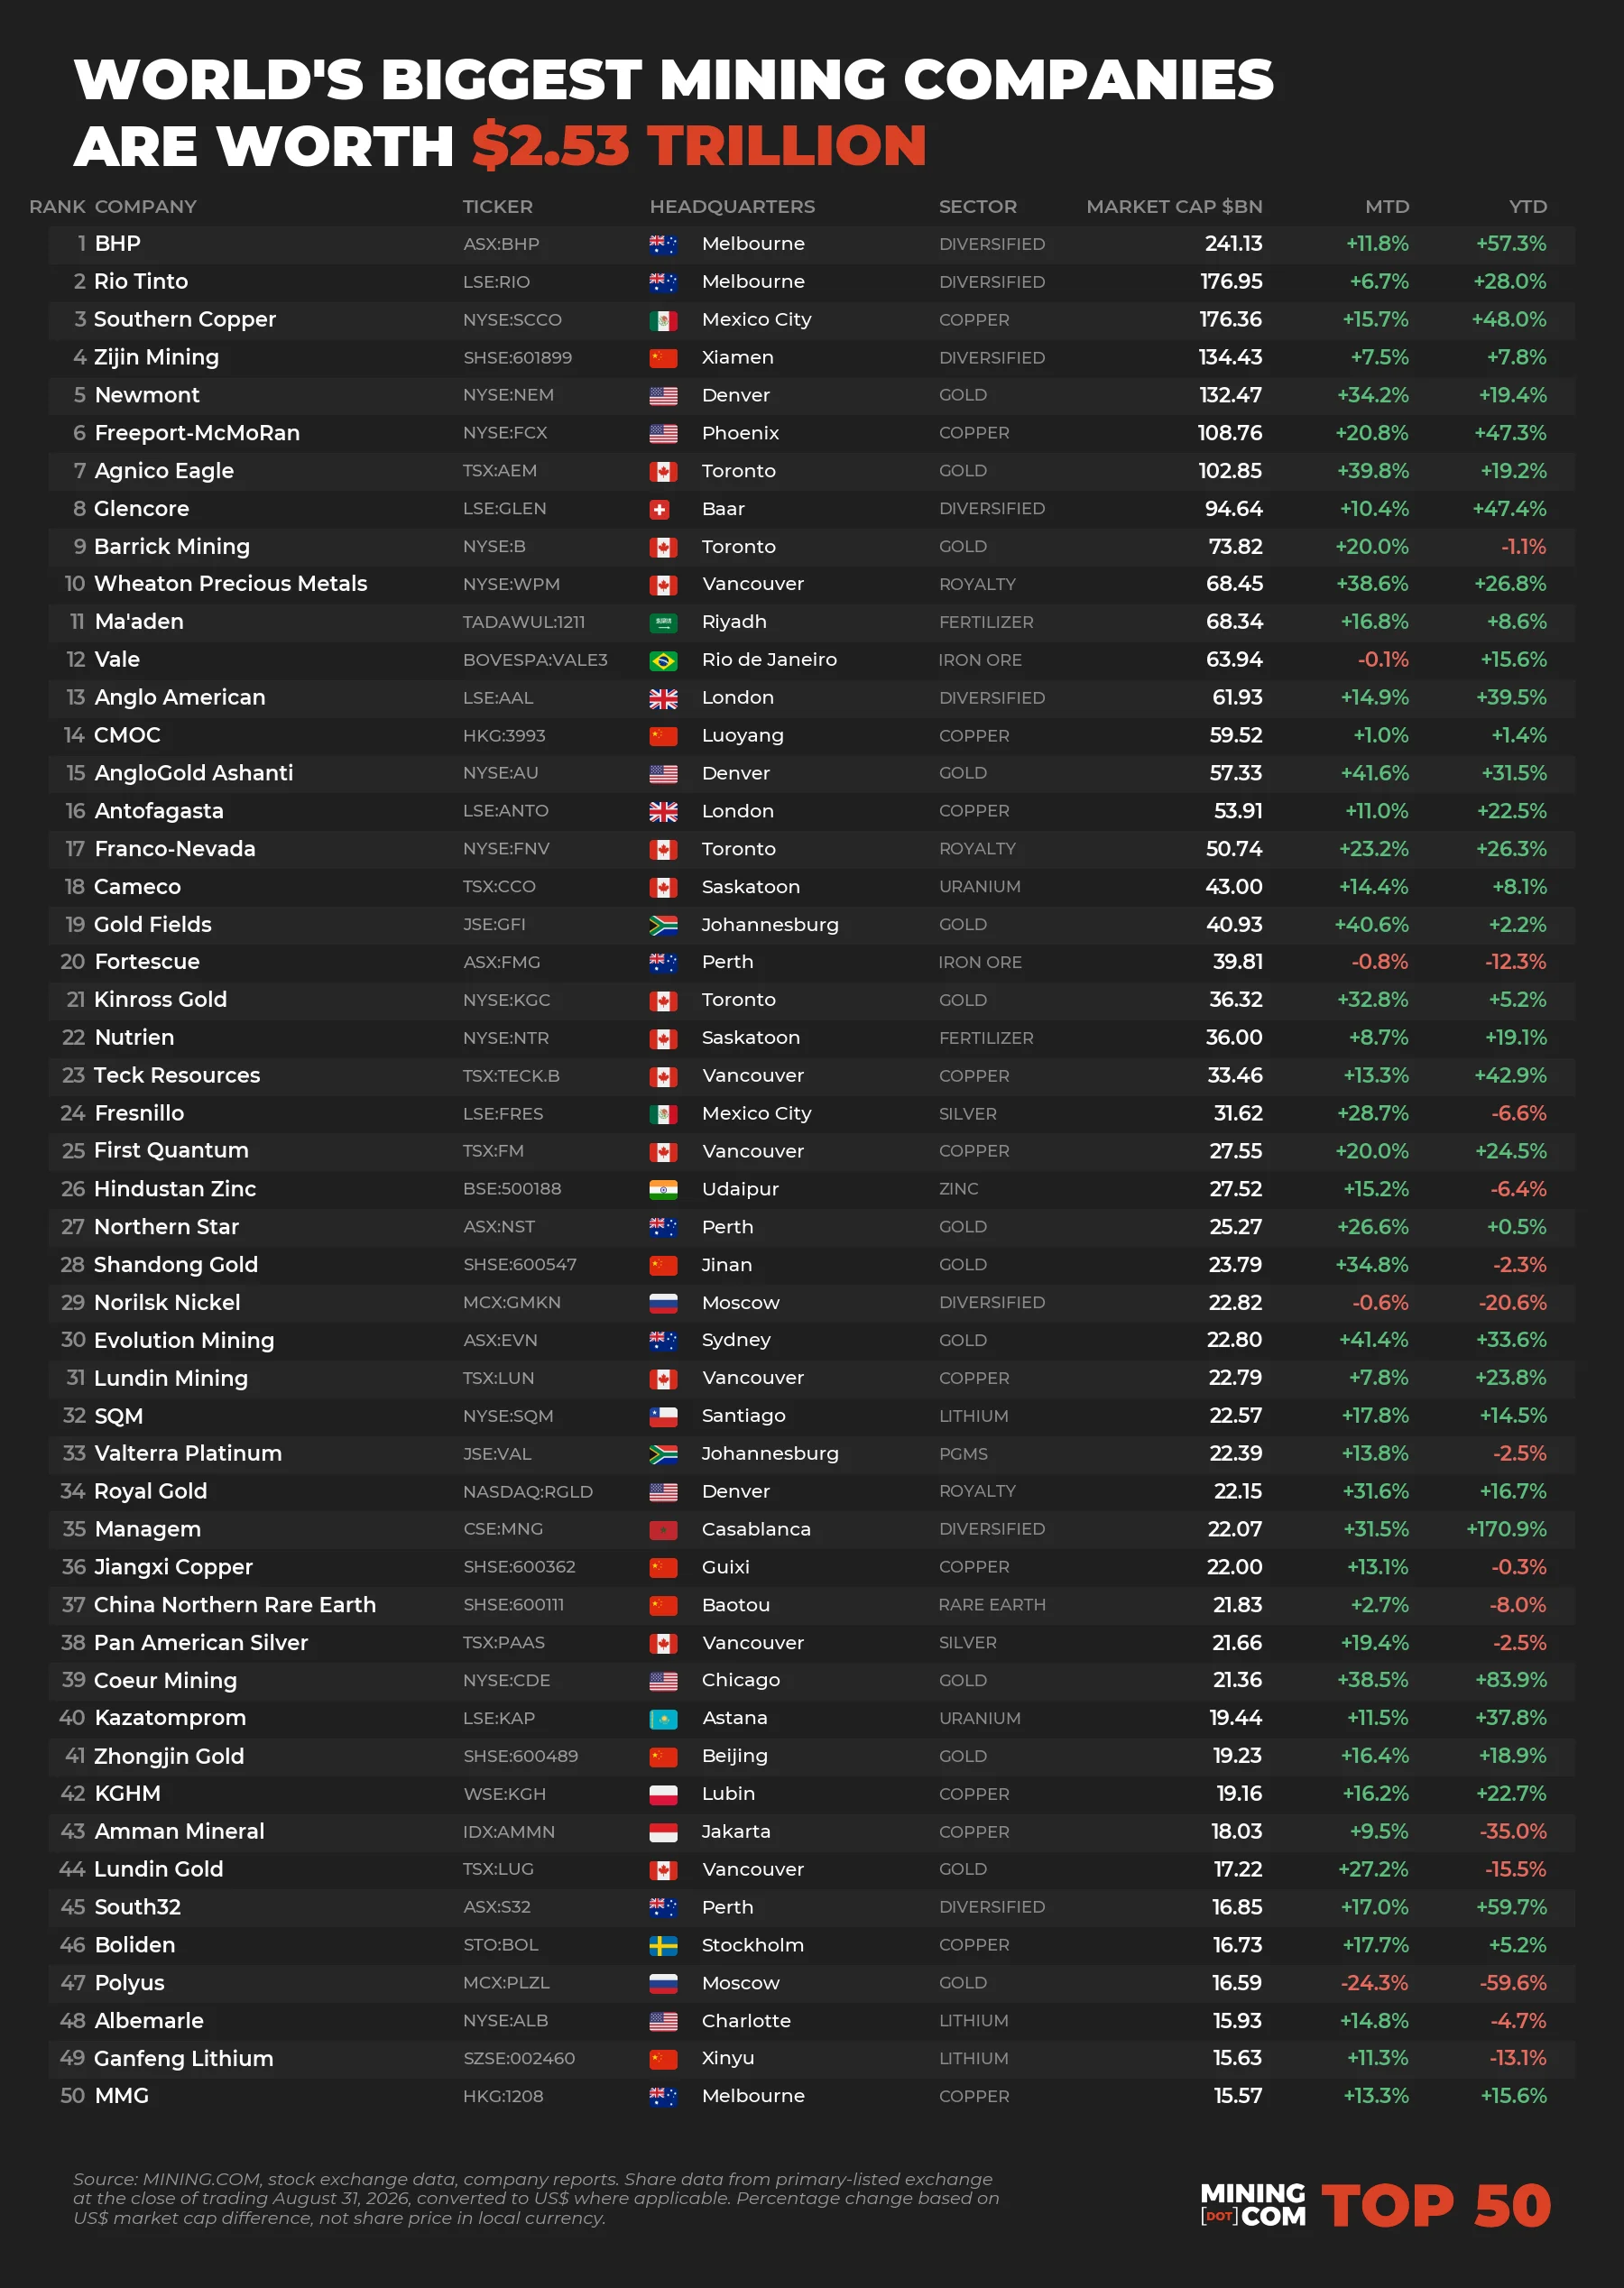
This month, gold and silver companies collectively accounted for $183 billion of the market's uplift, with gold miners contributing $138 billion alone—a remarkable 31% increase within just four weeks. Notably, twelve out of the thirteen gold stocks in the ranking posted gains, with one standout performer being AngloGold Ashanti, which achieved a 41.6% increase, equating to nearly $17 billion in value after a substantial rise in quarterly profits. Australia’s Evolution Mining enjoyed similar success, reportedly increasing by 41.4% following record profits and a substantial dividend boost.
The largest contributors to the rankings were Newmont and Agnico Eagle, adding $34 billion and $29 billion in market value, respectively. Newmont’s notable performance was attributed to higher-than-expected profits despite a decline in output, while Agnico Eagle benefited from record cash flow and dividends. Both now boast market caps exceeding $100 billion, establishing their positions firmly within this upper echelon.
Despite the recent rally in precious metals, it's essential to recognize that these stocks remain approximately 19% below their peak values from late February. In essence, August only recovered about half of their previous losses.
The Copper Dynamic
Southern Copper distinguished itself this month, briefly overtaking BHP and Rio Tinto to capture the no. 2 position in the rankings—a notable achievement considering these two have historically dominated the landscape. On August 24, Southern Copper's shares reached an all-time high driven by exceptional quarterly results and an impressive copper price above $14,000 a tonne. By the month’s end, although Southern Copper fell behind again, it remains a strong competitor with substantial year-to-date growth of 48%.
The twelve copper companies within the rankings collectively experienced a $70 billion increase in value in August. Industry mainstay Freeport-McMoRan notably surged by 20.8%, significantly benefiting from a solid performance amid operational challenges at its Grasberg site. BHP also reported robust gains, contributing an additional $25 billion as copper officially overtook iron ore as its top revenue generator following a successful fiscal year.
Emergence of the $100 Billion Club
This month’s resurgence led to an increase in the number of companies surpassing the $100 billion valuation mark, now totaling seven with the additions of Newmont, Freeport-McMoRan, and Agnico Eagle. The largest players include BHP, Rio Tinto, Southern Copper, and Zijin Mining, with Glencore remaining just shy at $94.6 billion despite a 10.4% increase in August.
Setbacks in the Gold Sector
While the overall trends were positive, Polyus, Russia's largest gold producer, faced a stark decline, with a staggering 24.3% drop in market value, losing $5.3 billion overall. Polyus' troubles stemmed from a controversial decision to suspend dividends until 2030 to finance new projects, spooking investors and leading to sharp stock declines. This contrasted sharply with the rising values of its peers.
The disconnect between production and valuation for Polyus is noteworthy. The company's current stock price implies a valuation of just over $6,000 per annual ounce produced, significantly undervaluing its potential when compared to competitors like Newmont or Agnico Eagle.
Shifting Rankings
With a bottom-line market entry threshold climbing to $15.6 billion, the rankings saw notable shifts this month as well. Companies like Lundin Gold re-entered the list following a 27% monthly increase, while Western Mining fell back out. Over the past year, several firms have risen within the top 50, including Coeur Mining and Kazatomprom, benefiting from advancing operational performances.
Global Mining Market Elevation
August's impressive $357 billion increase represents the largest single monthly gain for the mining sector since 2019. This comes after a turbulent year when March saw $420 billion vanish from market values amid declining gold prices.
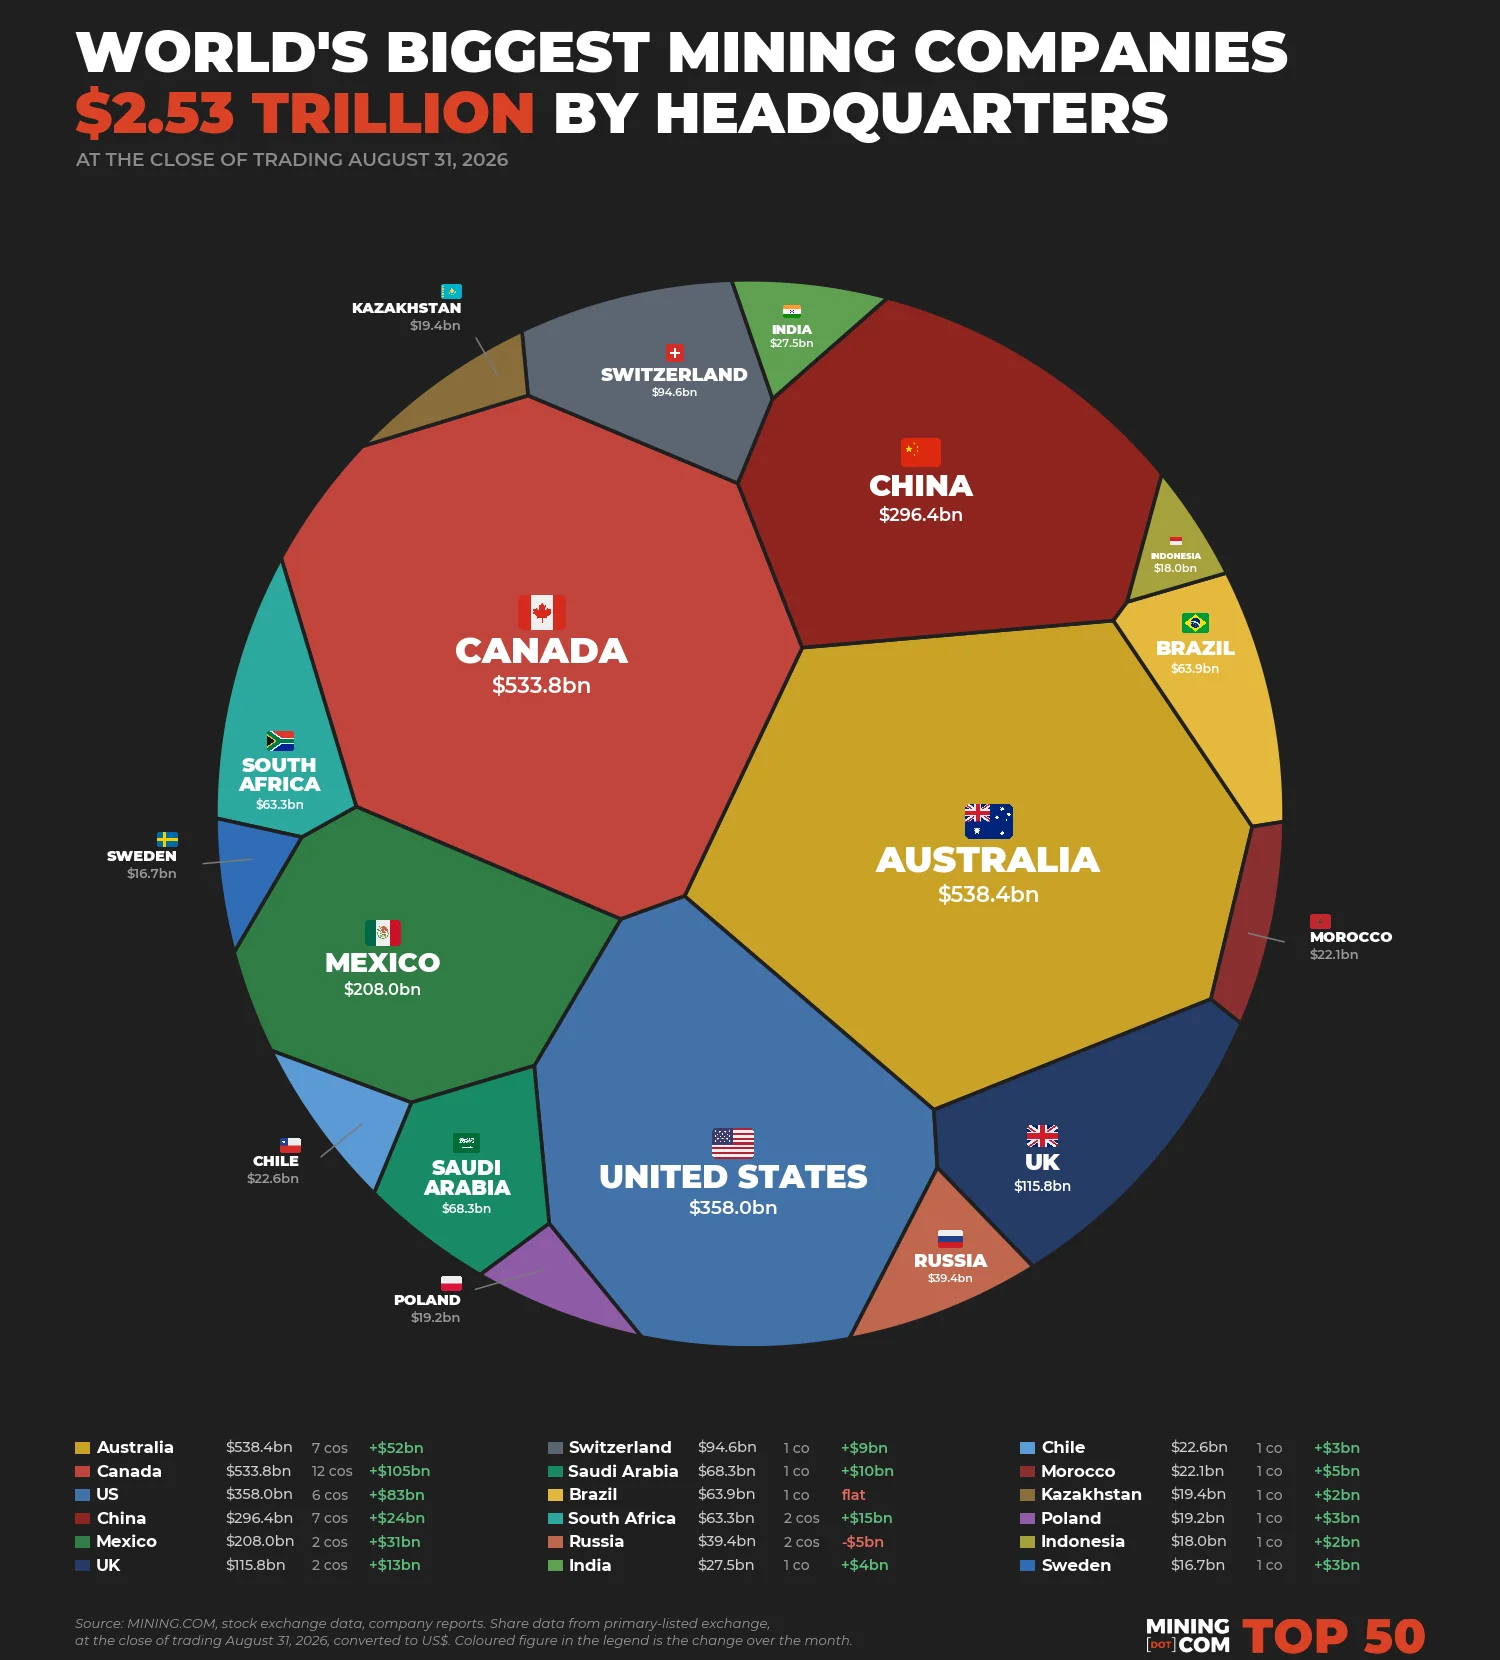
The recent rally also realigned the geographical dominance of the mining industry, with Australia surpassing Canada in value, now totaling $538 billion compared to Canada’s $534 billion, despite Canada housing more companies within the top rankings. The United States follows at $358 billion, supported by its golden and copper assets, while Russia languishes at $39 billion.
Given these dynamic shifts, the mining sector appears poised for continued volatility, with market participants closely watching both commodity prices and global events that could impact future valuations.
METHODOLOGY

Source: MINING.COM, stock exchange data, company reports. Share data from primary-listed exchange at the close of trading August 31, 2026, converted to US$ where applicable. Percentage change based on US$ market cap difference, not share price change in local currency.

Each company is assigned a single sector based on revenue sources, which can lead to contentious classifications. Some companies are excluded from the rankings due to their status or the nature of their business. Please refer to our detailed methodology for more insights.
Discussion
Sign in to join the discussion.